1. Understanding Error Messages
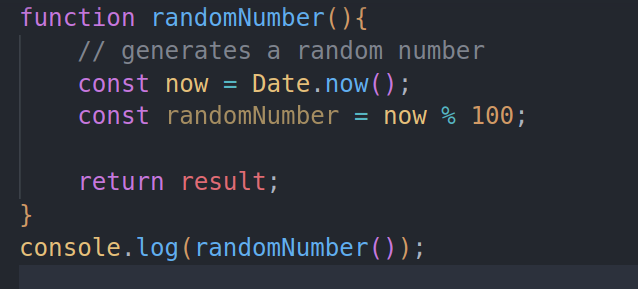
"Debugging any piece of code starts by understanding how to read error messages. If you are using an IDE, like VS Code or terminal , it does a good job of telling you specifically where the error occurs. For example, let's look at the piece of code below:"
If we run the code above, we get an error that looks like this:
The error messages give us a clue that the variable result is being referenced, yet it hasn’t been declared. When we examine the function again, we can see that the issue is with the return result statement , and to solve it we should instead return random number instead.
2. Browser Tools Are Your Best Friend
One advantage of JavaScript is that it's the language of the web. As a JavaScript developer, your go-to tool for debugging is the debugging tools provided by your browser, such as Chrome Developer Tools.
Whenever you work on an application, always have your Chrome Developer Tools open to catch any errors that might crop up in real-time.
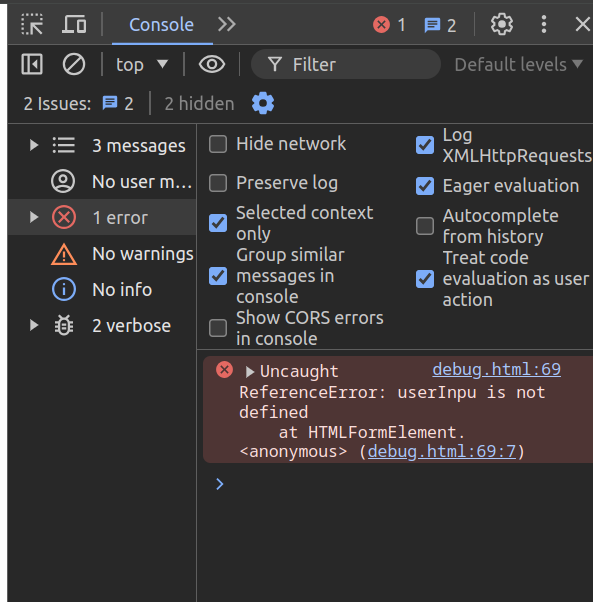
To use the browser tools, right-click on the webpage, click 'Inspect,' and the Developer Tools should open. Here, you can see errors in real-time."
From the image above, we can see that the error is caused by line 69 in the debug.html file
3. Beyond console.log
console.log is one of the many ways to debug your code, but it's also important to explore other methods like console.error, console.warn, console.info, console.assert e.t.c for different types of debugging.
console.error
console.error() is a method used to output error messages to the console. These messages are displayed with a red icon (or in red text, depending on the console), making them stand out. This method is particularly useful in try...catch statements to log errors when they occur, providing a clear visual indication of the problem.
console.trace();
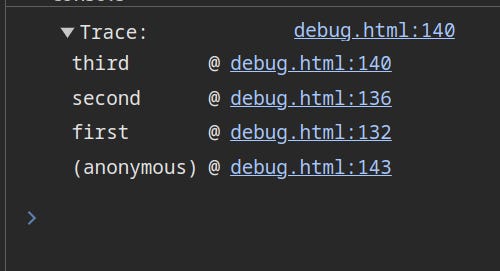
JavaScript is a single-threaded engine, meaning only one function can be executed at a time. console.trace keeps track of the nature of function calls and outputs a stack trace that shows the path taken to reach a point.
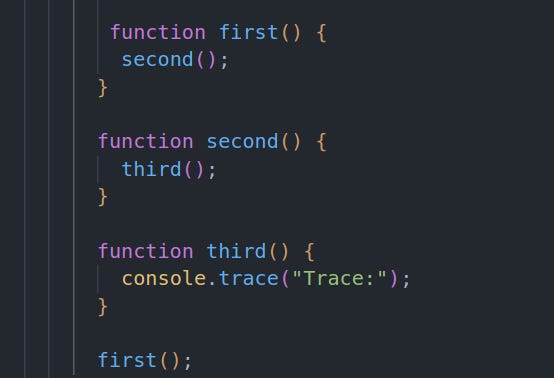
For example, suppose you have a combination of functions as shown below.
When the third() function is invoked, it prints a stack trace detailing the steps taken to reach this point. The stack trace will look like this:
console.time() and console.timeEnd()
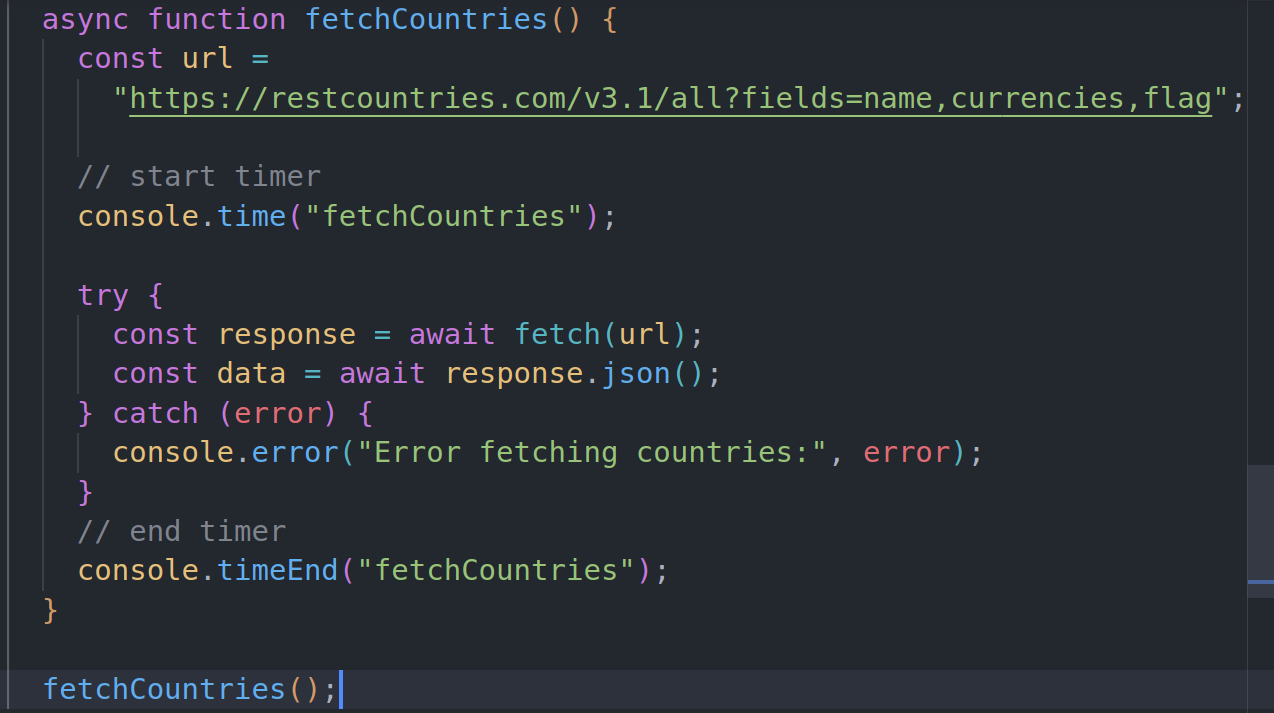
console.time and console.timeEnd are methods provided by the browser's console object that allow you to measure the time taken for a specific block of code to execute. These methods are particularly useful for performance monitoring and optimization. For example, suppose you were fetching data from an API, we can use it as shown below
console.assert
console.assert is a method that writes an error message to the console if the assertion is false. If assertion is true, nothing happens. Assertion is a statement which evaluates to either true or false. Assertion helps catch errors and unexpected conditons early in the development process.
For example
In the code above, the console.assert(condition, message) will check if the condition is true. If the condition is false(anytime the 2 passwords don't match) it will log the message "passwords do not match"
console.table()
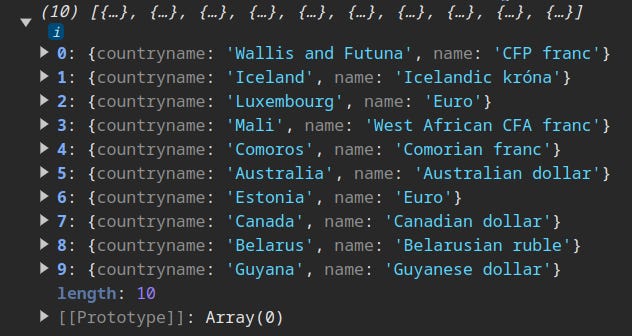
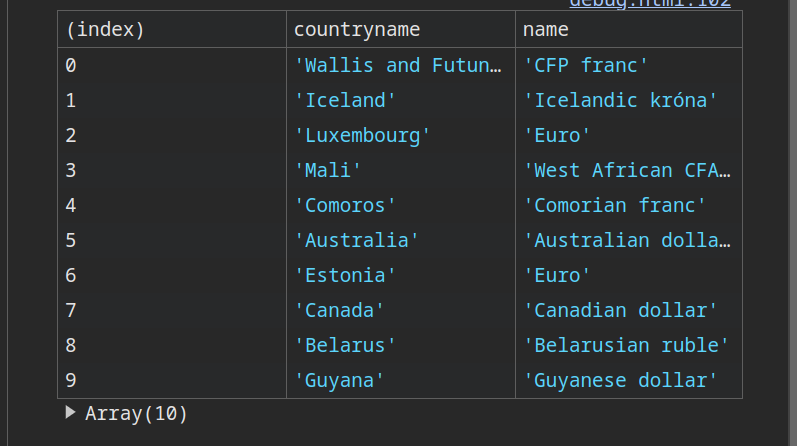
console.table is a method provided by the browser's console object that displays data in a table format. It is useful for visualizing arrays and objects, making it easier to read and understand the structure of the data.For example, suppose you have a function that logs an array of values like this
The output will look like this:
But if we change the console.log (countries) to console.log(table), the output is nicely formatted as shown below.
4. Always remember to return in functions that must return values
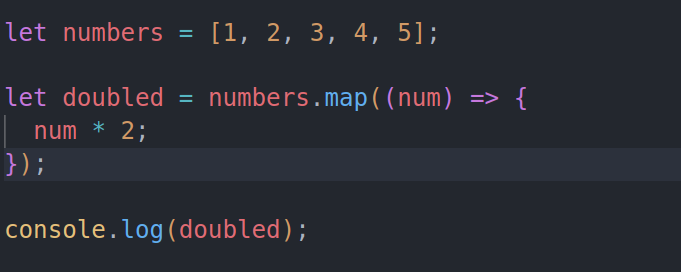
I can't remember the number of times I have been stuck debugging a piece of code simply because I forgot to use return in a function that is designed to compute a value, for example, let’s look at the code below
The output of the code above will be [ undefined, undefined, undefined, undefined, undefined ] , this is because the map() function transforms each element and returns a new array, but we haven’t defined the return explicitly,
So, to fix this, we need to update the code as follows:
Conclusion
Stay tuned for the next part, where we will dive deeper into more debugging tools


